|
Introduction
|
||||||||||||||||||||||||||||||||||||||||||||||||||||||||||||||||||||||||||||||||||||
|
DNS servers are the most trusted component of your web browsing experience but few people understand how they work or how their security vulnerabilities can cause you problems. If you're not sure what it is then I recommend that you read both What DNS Servers Do and if you plan to change your DNS servers then read How to Change DNS Server. There are three sections in this how-to guide.
These free programs will help find the best DNS servers for youTwo free utilities are recommended to help you to find the best DNS servers for your system: DNS Benchmark and namebench. Both can run on Windows, Max OS X, and Linux. These benchmarking programs use their databases of DNS servers to test those that will give you the best improvement. Both programs are portable (run without installation), use similar tests, and provide results that are roughly comparable. The differences in their tests are amplified by their different styles of reporting.
DNS Benchmark is the best program for users outside of North America as it clearly identifies one problem that namebench does not: where DNS servers have slow response times for major dot com sites which are usually based in the United States.
[show-hide toggle]
How do they work?DNS Benchmark and namebench use processes and tests that are similar enough that I can discuss them together in this overview. While they using similar tests their results can be quite different and as you will see in the example tests namebench results are generally less reliable. Both programs use three groups of DNS servers that you can test:
Both programs run similar tests:
[show-hide toggle]
How often and how much time will I need to test?You shouldn't have to test your DNS server speeds very often. Normally you would do it once and not do it again until you need to which i when
If the results seem unusual, e.g. your ISP's DNS server is taking a long time to respond, then run the tests again at a different time. Of the two programs, namebench is much quicker for the more comprehensive test - I installed and ran the full test in about 10 minutes. I had installed and run the DNS Benchmark global server test in well under 5 minutes but you should run the more comprehensive test of regional servers to get the best rsults - that took closer to 45 minutes.
1 namebench defaults to 10 servers but at present it only has 9 global servers listed because it is limited to the "anycast" DNS servers: DynGuide, Google, OpenDNS, UltraDNS, etc. Anycast is the protocol used for routing DNS requests through their networks for larger global DNS server networks.
[show-hide toggle]
What is likely to be the best combination of DNS servers?At home or in smaller organizations, your ISP is in the best position to provide speedy DNS resolution. In a large organization with its own private network or Intranet then you can run your own DNS server which also offers further options for administering your network. To introduce some redundancy (alternative sources) your best performance is likely to be from from a mixture of DNS servers that are close to your location and a global network that has a large cache. For example:
The speed of response for a DNS server normally depends upon three features of the technical infrastructure:
There is a fourth element which is nothing to do with the technical infrastructure. It is who you are.
In Table 2 I've given you an indication of how those factors vary for different types of DNS servers. The colour coding (key below the table) is a rough guideline. To check what actually happens for your configuration you should test because these generalizations can break down for all sorts of reasons.
[show-hide toggle]
|
||||||||||||||||||||||||||||||||||||||||||||||||||||||||||||||||||||||||||||||||||||
|
In a Hurry? Just want to download the software?
|
|
|
|
|
Check this list before you start testingOnly the DNS test program should be using the Internet connectionYour results will be affected by other traffic and may not be consistent with any later test. Likewise, any traffic on your local network can also impact the test results so consider turning off everything except the test computer and the other devices that you need to connect to the Internet, e.g. your router and cable modem. Ensure that your firewall does not block the testsIf your firewall has outbound-blocking then it can block the tests. You might need to turn that off temporarily by following the specific instructions for each product. The first test is likely to be most accurateThe first test may test with DNS address requests that are not stored in the DNS servers cache. Any later tests will be running the same queries which should then be resolved from the server's cache meaning that it will be faster. That will still give you a very useful test result but it could disadvantage servers added to any later tests and it will make a difference to the proportion of requests that are resolved from the server's cache. So if you have your own list of DNS servers that you want to test then now might be the time to use them. To do this you may need to create a custom list in DNS Benchmark or setup a configuration file in namebench. Standardize the reporting of results, if you canIn DNS Benchmark if you are doing more than one set of tests and you want to compare the graphs then you will need to set the graph scales before starting the first test. Goto the DNS Benchmark menu and select Set Graph Scale. The graphs are automatically scaled to fit the longest response time. As two tests are unlikely to have the same worst time then the scales will almost always be out unless you set them manually. Whereas namebench line graphs are set to 200ms and 3500ms the bar graphs have no fixed scale and cannot be standardized.
How to install the softwareThese programs don't have Windows installer programs so they won't create program folders, modify the registry, or create shortcuts on the desktop of start menu.
Copy the downloaded files to the folder you want to run them from They also won't create their own folders to install to so if you want that you will have to do it yourself.
Download additional files as required If you want to use the namebench command line to have more control over options then you need Python 2.5 to 2.7 to be installed. UNIX and Mac OS X usually have it so it is mainly Windows users who might have to install it.
[show-hide toggle]
|
|
In this section I explain how to test using a real examples. Testing with DNS BenchmarkYou will very quickly notice that this program is very verbose. It always explains what is happening and the website provides much more detail on every aspect of its operation. This might put you off but if you follow the steps in this guide you don't need to know all the detail as I've included the main points here. 1. Start DNS Benchmark
To view the DNS servers click on the Nameservers tab highlighted above. You will have to wait about 10 seconds for the list of servers to be loaded. Your system DNS servers will appear first in the list. The remaining servers are sourced from DNS Benchmark's list of global servers. The advantage of this approach is that you have the opportunity to refine the server list before testing.
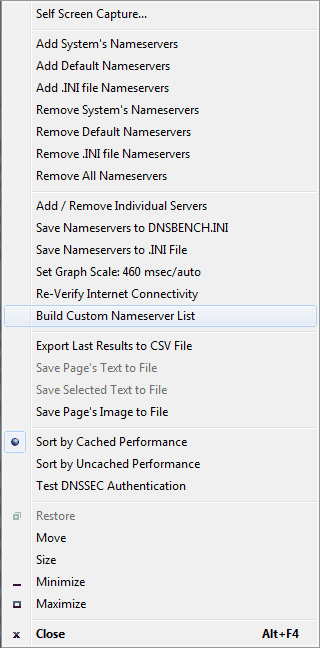
At this point you can add or remove servers by using either of two menus:
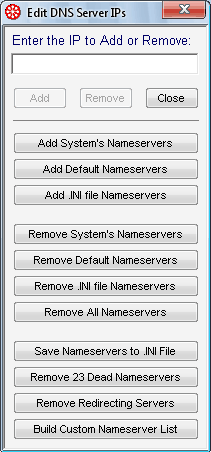
. The servers can be added or removed individually or in three groups:
You can remove all servers to clear the list and start again. Once complete you can save your list to an .ini file. There are two further options that you might consider to prune the list:
2. Run the global server DNS benchmarkAs well as clicking on "Run Benchmark", you can also click on the Gibson Research Corporation (GRC) logo to start or stop the benchmark.
I appear to be using my fastest DNS servers because they are indicated by darker boxes and they are the first three:
The main results in red display the results of cached queries. These are the fastest possible resolutions of a DNS query becase the server already has the DNS record in its cache. DNS Benchmark provides two particularly useful test results if you check the Show Uncached checkbox:
The servers that are reported to be fastest are my ISP's DNS servers. There is no need to change as I am already using them. The UltraDNS server has a red bar displays over the server IP address on the left. This indicates that it is having a problem with lost queries. It is not a big problem because queries are lost all the time so they get retransmitted. If that were one of my DNS servers then I would test again at another time to see if it is a regular problem. 3. Create the regional DNS server list
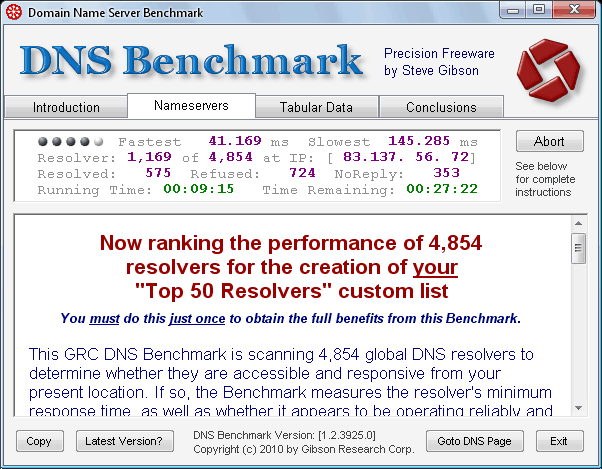
The Custom Namerserver List is a list of your regional DNS servers that are likely to give you the best service. DNS Benchmark goes through its database of nearly 5,000 DNS servers to find those that are likely to perform best for you. It creates the list and then you can run the benchmark. While it is creating the list, which takes about 35 minutes, you can see the total number of servers including the following:
4. Run the regional DNS server benchmarkThe regional DNS server benchmark runs immediately the custom server list is completed. In every other way it is the same as the default server benchmark. 5. Analyze the results
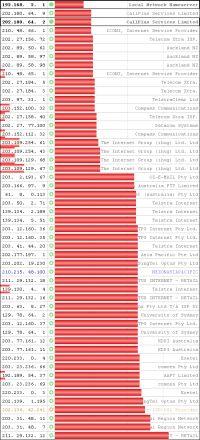
DNS Benchmark displays the results as it works so you will quickly be able to see which DNS servers are performing the best. I've drawn a few conclusions from the set of final results displayed at right. Note that DNS Benchmark allowed me to save these results as an image file because a screenshot wouldn't show enough servers.
Query response time = network latency + server processing time
Remember that DNS Benchmark has several tabs to view the various results:
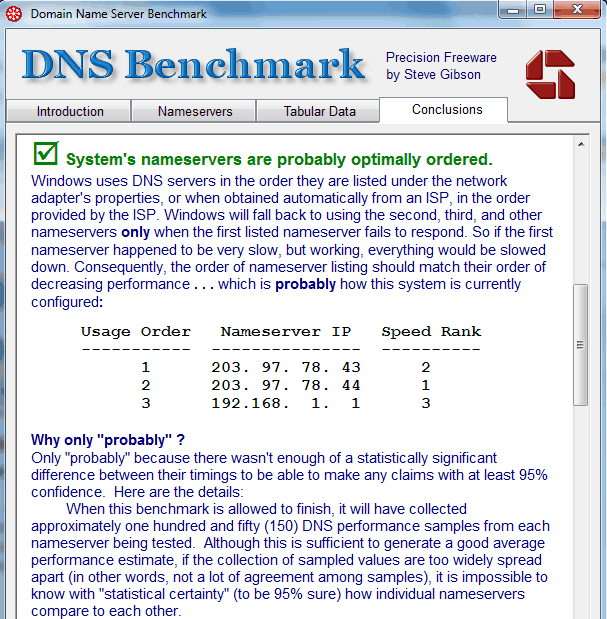
Here I show you the most important conclusion that DNS Benchmark correctly documents. My current configuration is correctly indicated and DNS Benchmark simply suggests that I swap my two ISP DNS servers. ipconfig /all
DNS Servers . . . . . . . . . . . : 203.97.78.43
                                    203.97.78.44
                                    192.168.1.1
6. After completing the benchmark:The DNS server list will be saved in the default.ini file. As discussed above, you can amend the list or detete it and start again. To save the results go to DNS Benchmark's System Menu and select 'Export last results to CSV file'. DNS Benchmark also provides for saving any of the results pages either as an image file (.png or .bmp) or a formatted text file (.rtf). I altered my router configuration and it took effect the next time I restarted my computer and was assigned the DNS configuraton from the router: ipconfig /all
DNS Servers . . . . . . . . . . . : 203.97.78.44
                                    203.97.78.43
                                    192.168.1.1
Testing with namebench1. Start namebench.
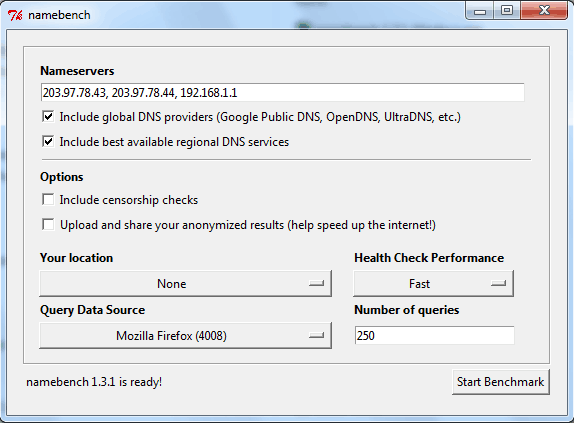
2. Set to test both global and regional DNS serversBefore running the benchmark check that these two options are on. They should be on by default:
3. Run the benchmarkFirst, namebench checks the connection quality and makes adjustments for the connection condition. That is why you should not have other Internet activity while running the tests. namebench then selects the fastest to benchmark:
The DNS queries are sent to the selected DNS servers.
The results are then saved in html and csv formats. Finally, the html results are displayed in the browser chosen for the test.
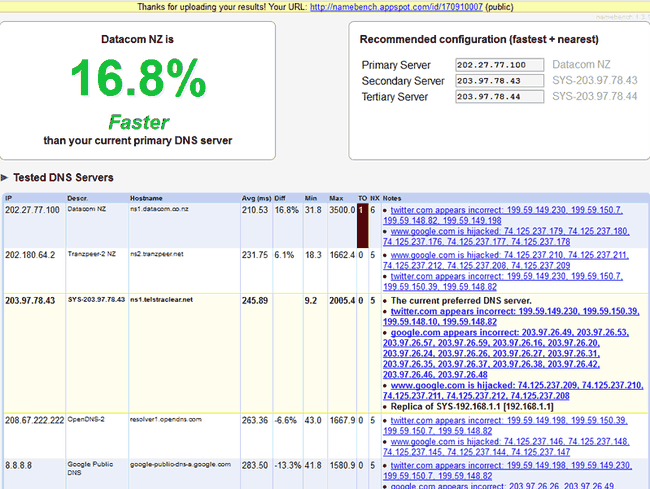
4. Analyze the benchmark results.A. The report tableThe primary report is a table.
Click on the screen shot of the results to see the results of the test that I ran:
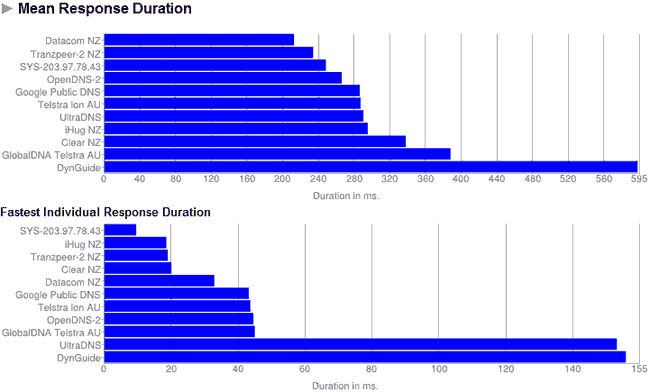
B. Bar graphs of response timesThere are two types of graph presented. The first are bar graphs of the average and fastest response times. Note that each graph uses a different scale. The averages response time is affected by the size of the DNS server cache. Global DNS servers perform much better because they have larger servers with larger name databases. OpenDNS, Google and UltraDNS are ranked fifth to seventh but still remain significantly slower than the closest DNS servers.
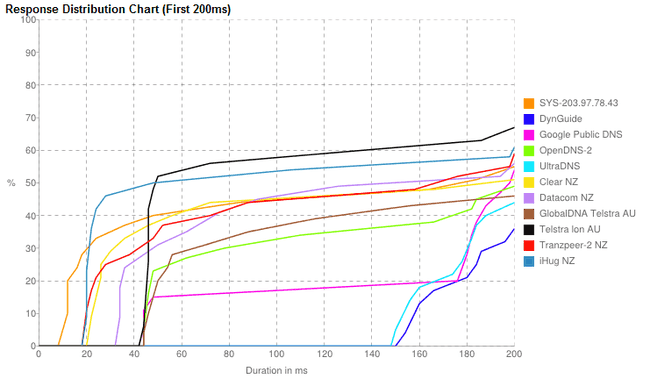
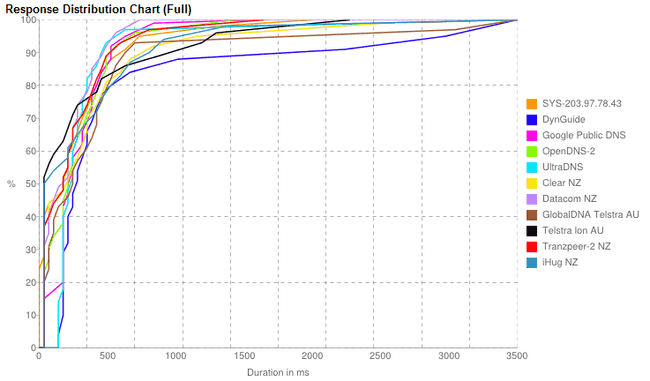
The second graph shows the fastest response durations. These are roughly proportional to the distance to my computer. The faster New Zealand DNS servers are grouped before the fastest Australian DNS servers which have are actually global servers like Open DNS and Google Public DNS. For comparison, here are my graphs from two years ago. You can see that both the global and regional servers in Australia have improved their relative performance in their fastest response times which have dropped from 145ms to 45ms - that is impressive. It is due to the global servers being installed in Australia in the meantime. Yet the average response time is no better. C. Line graphs of cumulative response timesThe distribution graphs show what percentage of queries are answered in what period of time. The first graph is for the first 200 milliseconds ie 0.2 seconds. The second graph continues to the 3.5 second (3,500 milliseconds) default for the timeout. Although it is available when you first view the results, when you go to the website it will not be there. Instead the online results include sample index results for Wikipedia.com and Google.com. This graph shows how the global providers though slower at the start can catch by the time all queries are completed. It is the long tail for the slower response times that will be noticeable when you are browsing. This is more important than the fastest response time because the best and worst are less than 1 second apart whereas the best and worst at completing queries will differ by 2.5 seconds or whatever the timeout is set to. So if you are prepared to live with slightly slower average response times then you can reduce the really slow and annoying response times by using a global DNS service. Finally, the benchmark parameters are listed.
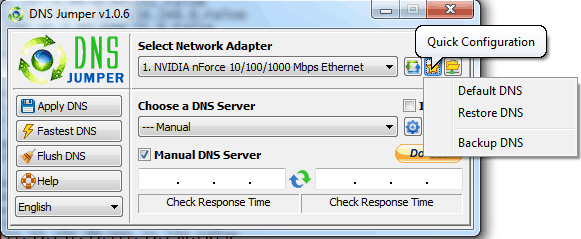
Testing with DNS JumperDNS Jumper is a quick and easy introduction to selecting a global DNS services. It is improving each year but the actual test results are too variable because only it only pings the servers which means the results can be significantly affected by many short-term effects. The sample server lists are much more limited than namebench and DNS benchmark which have thousands of servers compared with under a hundred here. But there are sufficient of the main global servers to provide some good options. 1. Backup your configurationThis is the main window showing your network card. I've selected the Quick Configuration button to do a backup of my DNS server configuration.
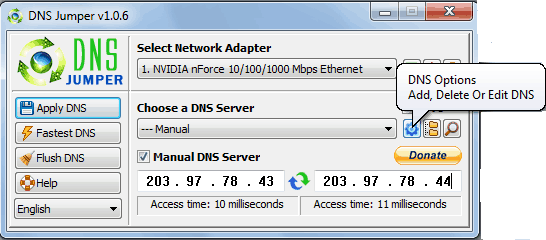
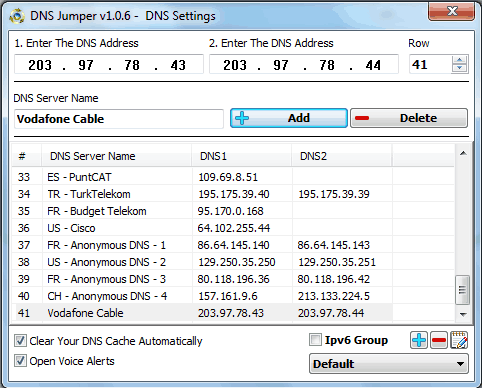
If you have more than one network card then select the network card that has your DNS server settings. There is a button, Flush DNS, for you to empty the DNS cache. In past tests this flush has not been as effective as using the Windows/DOS command "ipconfig /dnsflush". 2. Add your servers to the DNS server listMaintain the DNS Jumper database using the from the DNS Options button. Here I've manually entered the IP addresses for my ISPs DNS servers.
When I select the DNS Options button they are automatically transferred to the DNS Settings windows where I simply press the Add button to include them in the database.
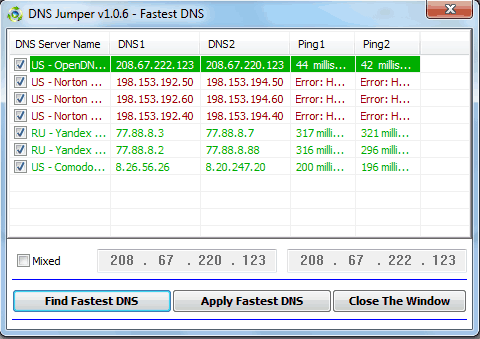
3. Find the fastest DNS serverFind the "Fastest DNS" has lightning icon on the button. You can search on any of the lists. By default there are two: normal servers and security servers which provide additional security features like filtering of bad websites as OpenDNS does. In the screenshot below I've found the fastest security servers.
4. Change your DNS configuration if you need toOne reason for including DNS Jumper is because it makes it easier to change your DNS configuration. So you can use it after running DNS Benchmark or namebench. It is important to remember that DNS Jumper is not testing how long it takes for a DNS query to produce a response. It simply pings the server to get a measure of how far away the servers are. So two servers the same distance away from your computer will show the same response time as DNS Jumper does not measure DNS query response times or timeouts. If you want to use the fastest servers then the final step is to select the "Apply Fastest DNS" button to save the change. Remember that you should have backed up your configuration first so that you can restore it if the change does not work as well as expected.
|
|
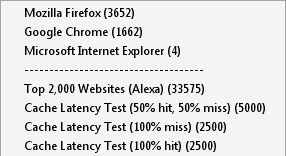
The average doesn't need to know about the configuration files and how to change some settings. Editing the configuration files before running the first test The first test will be the most accurate because it is more likely that the tested domains will not be cached. Once the test has run then any further requests for the same domain are likely to be cached. Therefore some advanced users might want to edit the configuration files before running the first test. namebench configuration filesWhere does namebench keep its files?
namebench has three configuration files in the config subfolder: namebench.cfg is the main configuration file and probably the only one that you will edit. I edited it to increase the number of servers tested and to add more global DNS servers.
hostname_reference.cfg contains two lists of websites.
These are tested everytime unless you have a version of namebench which includes the option to turn this off, ie download_latest = 1 becomes download_latest=0. data_sources.cfg points to the sources of the website test list:
DNS Benchmark configuration filesDNS Benchmark has two configuration lists which do not exist when you first run DNS Benchmark. I created both lists from those tested in namebench so that I can compare the results of the two programs. DNSBench.ini contains the list of DNS servers to be tested. It is not created until you decide to add or remove servers using the menu or until you have run the test to create your own customized list of servers. You can create many .ini files with different names and add or remove them from the test list anytime that you like. domains.txt contains the list of websites to be used for the tests. The default is the top 50 Alexa sites from 2009, there is also a list of 100 top Alexa sites. Note that both lists are uncensored so by testing these sites there is potential for embarrassment or worse. Both files are available at Resource Files for Advanced Benchmarking. dnsbench.exe /domains domains.txt DNS Jumper configuration filesDNS Jumper has one configuration file in the folder that you unzip the program to. While you can manually edit this file it is far easier to edit these entries using DNS Jumper's "DNS Options: Add, Delete Or Edit DNS" etc. DNSJumper.ini contains the sample DNS server list, a few program options, and the text for each language. 2 character country code " - " server name "=" server IP address "," server IP address "," True or False e.g. NZ - My setup=192.168.2.1,202.180.64.2, False True or False indicates whether it is one of the default servers to include in the speed test.
[show-hide toggle]
|
|
Related Products and Links
|
|
Using DNS servers for security
|
DNS Benchmark
namebench
DNS Jumper
|
This software category is in need of an editor. If you would like to give something back to the freeware community by taking it over, check out this page for more details. You can then contact us from that page or by clicking here
|
|
Domain Name System, DNS, DNS server, DNS resolver, DNS resolution, DNS name server, Internet name server, namebench, DNS Benchmark, DNS Jumper |
Back to the top of the article.
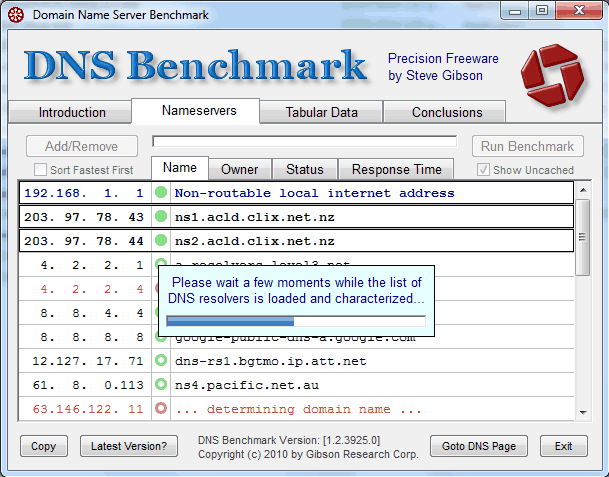
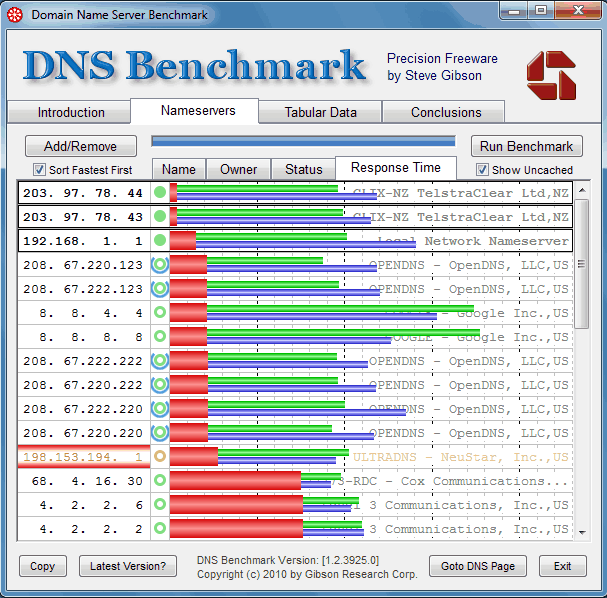
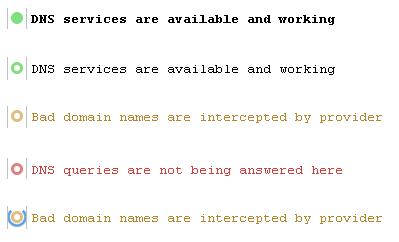 The first three servers are the system DNS servers as indicated by the solid green circle. But the third 192.168.1.1 is my NAT router which acts as the default DNS resolver for any computers on the network.




 We are looking for people with skills or interest in the following areas:

Comments
3 free, multiarch, dns cache/proxy
1 - namehelp (http://www.aqualab.cs.northwestern.edu/projects/151-namehelp)
2 - unbound ( http://unbound.net/ )
3 - Acrylic DNS Proxy ( http://sourceforge.net/projects/acrylic )
sorry if this is the wrong place
Some one help, I am getting Message" None of the 4517 server tested are healthy" while running DNS server name bench.Please recommend to make it.